Computomics’ AI-driven platform pairs predictive breeding with pangenome visualization, giving breeders the genetic architecture behind every crossing decision.
The breeding decisions you make this season are based on phenotype, pedigree, and maybe GEBVs (genomic breeding values). That’s the industry standard. But what if you could see the actual haplotype blocks you’re combining in a cross, know where your diversity is redundant versus complementary, and predict GxE performance before a single seed goes in the ground?
That’s not a pitch. That’s what’s happening right now at Computomics, a bioinformatics company based in Tuebingen, Germany, where a team of genomics and machine learning specialists has spent over a decade building tools that turn raw sequence data into actionable breeding intelligence.
“For the longest time, gene discovery was like trying to find a single word in an encyclopedia written in a language you don’t speak,” says Dr. Christian Kubica, Technical Account Manager at Computomics. “Now, with AI, we have the translation key in hand, and the message is more powerful than we ever imagined.”
From University Spin-Off to Industry Platform
Computomics was founded in 2012 as a spin-off from the University of Tuebingen, the Max Planck Institute for Biology, and the Friedrich Miescher Laboratory. That academic DNA still runs through everything they do: the company publishes in peer-reviewed journals, collaborates with research institutions, and contributes to open-source tools. But their focus has always been applied. The question driving their work is practical: Which genes matter most for this breeder, in this environment, right now?
Plants carry billions of nucleotides. But only a fraction of those genetic codes determine the traits breeders care about: drought tolerance, disease resistance, nutrient use efficiency. Historically, finding the key variants among the noise meant years of crossbreeding, field trials, and hoping something stuck. Machine learning changed the equation.
xSeedScore: Predicting Performance Before Planting
Computomics’ flagship platform, xSeedScore, is a predictive engine that models the non-linear interactions between genotype and environment (GxE), between genes (GxG), and can also factor in management practices (GxExM). It runs millions of simulations against genomic data and environmental variables to predict which genetic combinations will perform best in specific conditions.
For breeders, the practical impact is immediate. Take variety placement: seed companies sell varieties into diverse environments. xSeedScore can predict GxE performance across locations, allowing portfolio managers to identify where each variety has a real competitive advantage, rather than relying on broad regional averages. When three varieties in a lineup turn out to be genetically near-identical for the traits that matter in a given geography, that’s information worth having before you commit trial resources.
Kubica compares it to weather forecasting, except instead of predicting rain, breeders are predicting how specific genetic architectures will perform under real-world conditions. “The biggest shift isn’t speed, it’s visibility,” he says. “Breeders used to make placement decisions based on a few years of regional trial data. Now we can model performance across environments they haven’t even tested in yet, and flag genetic redundancy in their portfolio before it costs them a trial season.”
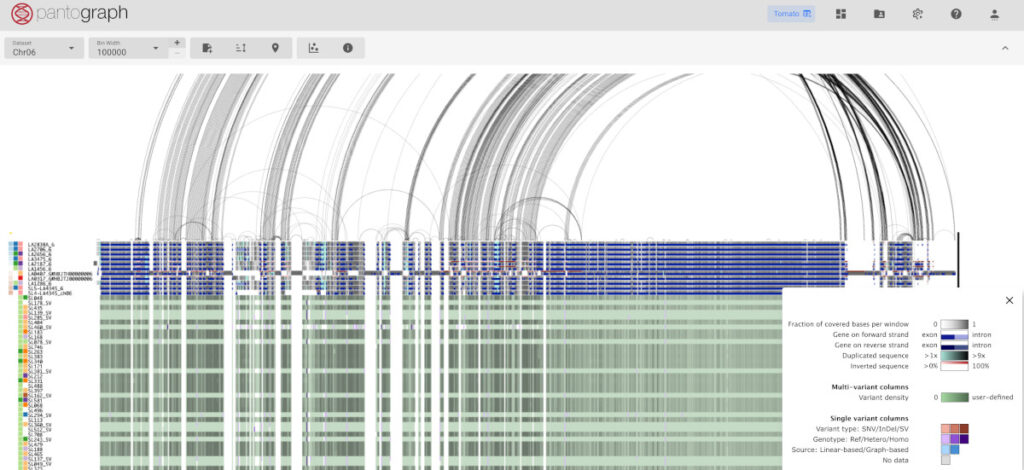
Pantograph: The Genome Gets a Map
Where xSeedScore predicts outcomes, Pantograph shows you why. Named one of Seed World’s Top 10 Innovative Products of 2023, Pantograph is a multi-omics pangenome browser: think Google Maps for the genome.
Rather than working from a single linear reference sequence (which inevitably misses variation), Pantograph visualizes a full pangenome graph, showing breeders the structural variation that conventional genotyping panels are blind to. And the platform keeps expanding: Computomics has added layers for transcriptomics, phenomics, and metabolomics data, making Pantograph an increasingly rich hub for exploring how genetic variation connects to real-world trait expression. It’s like adding richer and richer points of interest to a map you already use for navigation.
For parental selection, this changes the conversation. Instead of picking parents based solely on phenotype, pedigree, and GEBVs, a breeder using Pantograph can see the actual haplotype blocks being combined. Where is your cross bringing complementary diversity? Where is it redundant? xSeedScore predicts the outcome; Pantograph shows you the genetic architecture behind that prediction.
“We’re not replacing breeder judgment,” Kubica says. “We’re giving breeders a clearer picture of what they’re working with. The crossing decisions don’t change in kind, but they change in precision.”
Finding What Your Genotyping Panel Misses
One of the most compelling use cases Computomics has developed is marker panel optimization, an area where the economics alone get breeders’ attention.
Most genotyping panels are designed against a reference genome. That means they are systematically blind to variation that the reference never included: structural variants, presence/absence variants, and what Computomics’ Joerg Hagmann calls “hidden variation” in the germplasm. Pantograph exposes this blind spot.
“Your current genotyping panel may be missing a significant percentage of the variation in your germplasm,” Kubica explains. “We can identify which markers are actually relevant to your specific breeding population, include non-SNP markers that matter, and reduce the total number of assays you need. It’s a cost reduction, but more importantly, it’s a resolution upgrade.”
Real Results: Explaining Pathogen Resistance
In one recent project, a seed company had spent years trying to understand why certain lines in their breeding program resisted a specific pathogen while closely related lines did not. Traditional approaches hadn’t cracked it. Using Pantograph, the team identified the causal gene and variant responsible for resistance, a variant hidden in structural variation that standard genotyping had missed entirely.
The company refined its breeding strategy around that finding. That’s not a ten-year timeline compressed. That’s a question answered that couldn’t have been answered at all with conventional tools.
Breeding Intelligence, Not Just Data
Kubica pushes back on the idea that what Computomics offers is “gene editing targets” or “big data analytics.” The better framing, he argues, is breeding intelligence: the combination of prediction, visualization, and genomic context that answers the questions breeders actually ask every season.
What should I cross? Where should I test? What am I missing in my germplasm? Where is my next genetic gain coming from?
“These are the decisions breeders make constantly,” he says. “Not once a year in a strategy meeting. Every cycle, every cross. Our tools don’t automate those decisions. They make each one better informed.”
That philosophy, technology in service of the breeder, not the other way around, is what has kept Computomics relevant for over twelve years and attracted multi-million Euro investment. It’s also why the company continues to invest in making tools like Pantograph intuitive enough that breeders, not just bioinformaticians, can use them directly.
Climate Pressure Is Raising the Stakes
As climate change accelerates, the margin for breeding error shrinks. Erratic rainfall, rising temperatures, shifting pest zones: the old model of breeding for average conditions is increasingly unreliable. Context-aware breeding, selecting the best genetic profiles for specific geographies, soil types, and climate scenarios, is becoming a necessity rather than a luxury.
“We need crops that are robust across many conditions,” Kubica says. “That means unlocking the genetic variation in ways the industry hasn’t done before. The tools exist. The pangenomes are being built. The question is whether breeders adopt them fast enough.”
Your Crop May Already Have a Pangenome Ready
Computomics is adding new species to their pangenome database continuously. Whether you’re working in row crops, vegetables, or specialty crops, there’s a good chance the foundational genomic resources for your species are already in place or actively being built.
The team invites breeders to reach out with their crop and their questions. A consultation can quickly establish what’s possible: from GxE prediction with xSeedScore, to pangenome-level visibility with Pantograph, to a smarter, leaner genotyping strategy.
Visit computomics.com to book a consultation and find out what your data has been trying to tell you.